The last two weeks we’ve been discussing the standard business funnel of Awareness, Acquisition, Engagement, Conversion and Retention. We started with the Search News Central article, Measuring Metrics for Success, and now here we are at last, wrapping up the whole kit n’ caboodle. We have a lot to go through today, so let’s get started!
The Standard Business Funnel and KPIs
“What gets measured gets managed” is a popular Peter Drucker quote. It’s been reused and modified to include such wonderful wisdom as:
- You can’t manage what you don’t measure
- What can be measured can be managed
- If it isn’t measured, it can’t be managed
(sigh) Yes, Originality ‘R Us…
As soon as you start looking at metrics and the massive amount of data that pours in from a well monitored site, you start to realize something is missing in the measure = manage equation. Just because you can measure something, doesn’t mean you should. More specifically, just because you’re getting data back doesn’t mean all the data is important at that particular moment.
As mentioned in Measuring Engagement and KPIs, one of the hardest parts of analytics is that it’s easy to get overwhelmed. You have all these numbers:
- Time on site
- Click through rate
- Bounce rate
- Exit rate
- Entrance rate
- Cost per click
- Unique visitors
- Search engine vs referral vs direct visits
- Overall visitors
- Average sales
- Goal completion rates
Egads. The metrics multiply like rabbits. The data increases exponentially the more you track (you should see some of the raw files we dig through before pulling a report together for a client). Insanity looms close. Therefore, we discover and define Key Performance Indicators, or KPIs, in order to make sense of what we’re seeing (and save ourselves from padded rooms).
Throughout this series, we’ve given you some potential KPIs to use as indicators of success. Obviously, you need to look at the tips and pointers we give in the light of your own business, but they should give you ideas at the very least. Each post talked about market segmentation, why it matters for that part of the funnel, and so on. Today, we’ll go a little deeper into that.
Defining KPIs? Goals Matter!
When testing computer performance, testers have a baseline. The number one goal for the computer is to achieve that baseline. Surpassing the baseline is a good thing. Below the baseline is a bad thing.
However, that goal is actually made up of several goals. The CPU’s ability to complete mathematical operations, how quick the disk reads/writes/seeks files and how efficient the memory is are just a few. Without a goal, none of that data would mean anything.
The same can be said for your marketing campaigns. You have to have a goal, as well as a baseline, before the data means anything. For example, if you’re trying to get a video to go viral on YouTube, would knowing the number of Twitter referrals coming to your site help you measure the success of the “viral video” campaign?
This is why Key Performance Indicators are fluid. They show the success of a particular action, and only the success of that particular action. They are forward-looking, not present-based.
In the standard business funnel, the chosen KPIs should answer the question: Was this step successful?
- Awareness – The chosen KPIs will show the amount of people acquired, based on the focus of the campaign. How many people responded to the TV ad, Facebook or Twitter campaign, newspaper ad, and so on?
- Acquisition – The chosen KPIs will show how many people engaged with the campaign’s point of focus (i.e. clicked around the website, made a blog comment, responded on social, made a phone call…)
- Engagement – The chosen KPIs will show how many people began the conversion process, based on the campaign’s point of focus (i.e. began filling out a form for more information, started into the shopping cart funnel, etc.)
- Conversion – The chosen KPIS will show how many people finished the conversion process (i.e. visits to the “thank you page”, money in your account, information in your email, etc.)
- Retention – The chosen KPIs will show how many return to repeat the process in some way (i.e. continue to engage on social, become repeat customers, return visitors to your site, etc.)
Once you define those KPIs, it’s time to set the benchmarks.
Benchmarks – You Are HERE
We’ve written about benchmarks before, although it’s been quite awhile. You can read more about them with SEO Campaigns, Analytics, Benchmarks and Changes and SEO Campaigns and the Ever Essential Benchmark. Simply, you can’t know how well a campaign is succeeding if you don’t know what results you had before the campaign started. This is why benchmarks are handy.
We’ve created a simplified benchmark and KPI cheat sheet (download link) to walk you through a simple benchmark/performance tracking set up.
The scenario:
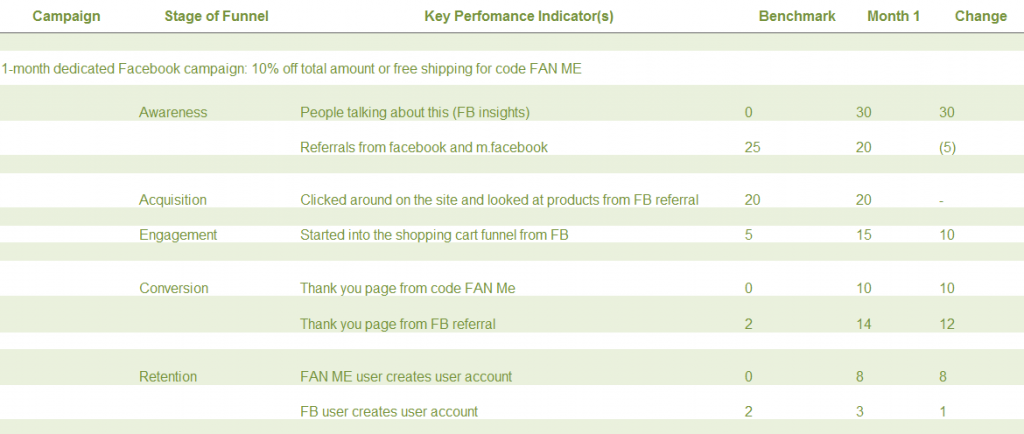
You want to start a 1-month dedicated Facebook campaign with an exclusive offer to your FB following. The offer is for 10% off the total amount of their order or free shipping if they use the code FAN ME at check out. What are you going to use to track the success of this campaign? If you just use the final step (the thank you page with the FAN ME code) and the campaign fails, how are you going to know why it failed? -Or will you, like so many others, just assume that Facebook won’t work for you?
You also want to pay attention to more than just an individual stage. For example, in the imaginary scenario, your FB campaign brought 5 less than the benchmark average of 25. Hmmm. Although that’s not necessarily a failure, it doesn’t bode well, does it?
However, on average, 5 drop out of the funnel before they ever really get started, where as all 20 referrals stayed on the site in the month of the campaign. Fifteen found a product they wanted to buy and started into the shopping cart funnel from FB. 1 drops out, leaving 14 that complete the buying process from Facebook. 10 are clearly from the FAN ME campaign.
The exciting part comes down to the Retention stage. Of the 10 users, 8 of them are new. They create a user account, which then goes into your customer database where they become repeat customers. As a bonus, you also gain 3 FB customers that may or may not have come from the FAN ME campaign (you don’t know for sure, because they didn’t use the code).
Now, hopefully your campaigns will bring more than 14 sales (although, depending on the average product price, you could be looking at hundreds of dollars). If it doesn’t, you’ll at least have a clear understand of what stage (or stages) the campaign failed.
Setting Up Analytics for KPI Tracking
Of course, before you can fill out the parts of the cheat sheet, you have to have the numbers, right? –And it’s much easier to garner the numbers if you already have them set apart for easy retrieval, right? Right. So let’s do that.
New Profile
- Create a new profile called “Facebook Campaign” (don’t worry – you can delete the whole bit after you’ve done the walk through).
Add Filter
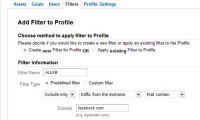 Make sure the profile name is “Facebook Campaign”.
- Click “Filters”
- Select “Create new Filter for Profile”
- Name the filter “ALLFB”
- Choose “Custom Filter”
- Include Campaign Name in the Filter Field, with the Filter Pattern set to FANME
- Make sure it’s not case sensitive and save.
Create URL
- Create a trackable URL using Google Analytics URL Builder
- For example, you might use:
- Website URL: http://mysite.com/facebook (directs to an FB specific page)
- Campaign Source: facebook
- Campaign Medium: social
- Campaign Name: FANME
- For example, you might use:
Advanced Segments
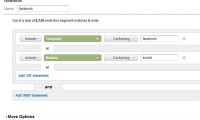 Under “Assets”, click “Advanced Segment”.
- Name it “Facebook” (remember, we’re original here). Include a source containing facebook.com OR m.facebook.com.
- Name it “Facebook”. Include a campaign containing “facebook” OR a medium containing “social”.
- Save.
Setting Up Goals
- Under “Goals”, click + Goal.
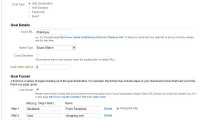
- Name it “Facebook FANME” (for an original flavor). Make sure it’s active.
- Choose “URL Destination” and enter the final “thank you” page.
- Set your first step in the goal funnel as the link to the facebook specific page on your site (as listed in step 2 of this walkthrough), as set it as a required step.
- Set your second step in the goal funnel as your shopping cart page.
- Save.
Custom Alerts
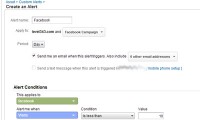 Under “Assets”, click “Custom Alerts”.
- Name it “Facebook” and apply it to the Facebook Campaign profile you created in step one.
- Choose to send you an email, text message or neither when the alert triggers (if it’s neither, you’ll just see it in the reporting).
- Set Alert Conditions to the “facebook” segment when visits are less 10.
- Save the alert.
- Set Alert conditions to “FANME” goal conversion rate of less than 5.
- Save the alert.
Now, once you start the campaign, you’ll use the URL you created for your Facebook link.
Finding the Data
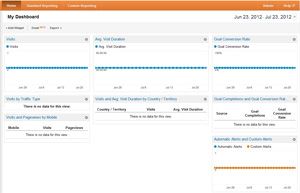
Now that everything is in order, you’ll want to be able to see everything, right? Right. So, how do you do that? In your profiles list, you will now find “Facebook Campaign”. On the Dashboard section, you can add widgets that will give you data at a glance; each widget links back to the data section.
As you click through the familiar pages of the Audience, Advertising, Traffic Sources, Content and Conversions tabs, you’ll start to see “Facebook” crop up everywhere. For example, you’ll see the goal funnel under Goals > Funnel Visualization. Under Traffic Sources > Sources > Referrals, you’ll find Goal Sets with the Facebook FANME designation. Under Traffic Sources >Sources > Campaigns, it will say “FANME”.
In other words, there won’t be the distractions of your every day average data. The Facebook Campaign Profile will give you all FB data, all the time.
The Icebergs Are Profuse
We finish many articles with “and that’s just the tip of the iceberg”. We’ll be doing the same here. Analytics, optimization, the three T’s (testing, tracking, tweaking)… it takes a bit of delving in and getting dirty. There’s much to learn, and a majority of it comes from practice and continual use.
We hope you’ve gleaned some useful information from the Measuring Metrics for Success series. We hope you’re able to turn the walkthrough into successful tracking implementation, as well as strong marketing campaigns. Thanks for staying with us. To your success!






3 Responses
Hi there, Traffic URL builder is very good option to track traffic stats. Thank for sharing these information. Generally i use Google analytics,Because it’s free and easy to use. Especially another Google product. It helps me lot to track my blog’s traffics and even adsence rates.
Online communication is a widespread way of spending free time these days. More and more users of both genders and different age groups consider this option a superb alternative to real-time interaction with people, which gives them a chance to share their views and ideas with lots of users they do not even know. No wonder, blogging is on the rise nowadays. It allows you to stay in touch with your devoted readers day and night, exchanging opinions and interesting thoughts with them.
Great post with excellent examples. I think it was Albert Einstein who said, ” Not everything that can be counted, counts and not everything that counts, can be counted.”