Understanding visitor behavior can help you make important decisions about how your business operates and what content is necessary to drive success.
As a business owner or marketing executive, it’s essential to know the response that visitors are having when they read your website copy or visit your page – do they like it? Are they clicking around multiple pages? Or are they bouncing off? Identifying this information can help you adjust strategies and improve engagement with potential customers.
In today’s blog post, we will explore ways of measuring and understanding visitor behavior and analyze what their actions say about the quality of your content.
Last month we talked about using analytics data to conquer the task of writing dynamic content and beat writer’s block. Today, we’re going to dig a little deeper into our analytics for more information. How many ways can you find the seed of life in your numbers? How many other root words can you find that you haven’t previously thought of?
In this article, we’ll go through understanding visitor behavior – do they like your content? And we’ll walk through one of our processes for measuring site quality. By the end of the how to, we’ll discover:
- what type of content we currently have that brings in strong traffic (our top ten list for the day)
- a non-performing page that needs repurposing, updating or deletion
- new key terms we haven’t yet targeted
- at least five new topics for our next blogging cycle
Get ready to follow along – learn what to look for! Grab a pen and paper, because here goes nothing! (Note: click on any image throughout this article to get a larger view)
Understanding Visitor Behaviors – Where Are They Going?
Okay, so you know you’re getting visitors, but do you know what they’re doing when they get to your site? You obviously hope they’re getting along with the business of visiting – reading content, clicking to other pages, spending time, book marking, buying, what have you –, but are they?
Peaks, Valleys and Annotations
Something Google Analytics has that many site trackers don’t is the ability to make annotations (which is why we’re using GA for this walkthrough). Each time you start a campaign, send out a blog or change something on your site, you can make an annotation and mark the occasion. This information becomes invaluable when you go in to see how well (or how poorly) your site is performing.
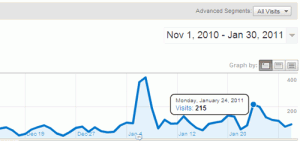
The image shows an example of these peaks and valleys, as well as annotations. Our Google Analytics shows a huge spike on January 6th, followed by a smaller upward trend on the 7th. Luckily, we had added the annotation that on the 6th we posted “Top SEO Women 2011”. We assumed the spike in traffic mainly came from this article, and further digging verified this information.
What if you haven’t done any annotations?
How do you figure out what caused a spike if you forgot to annotate something? It happens; we get busy with client work and keeping up on the annotations gets lost in the background. What do you do then?
Digging into the Data
Let’s look at a peak with no annotation. Further up the chart, we see another peak with no explanation.
The first thing we look at is the day (not date). It’s a Monday, which might have something to do with what looks like a peak. We know from understanding our visitors that most readers come during the week. Saturday and Sunday are historically quiet days for our site. However, this doesn’t explain the difference in numbers from Friday to Monday. We have to dig deeper.
Asking the Right Questions
We set the date range to the single day. This clears out all the information gathered about any other day since tracking begin. Our job now is to answer these questions:
- Where did the visitors come from? – This points to which referrers may bring better amounts of traffic to your site.
- What did they look at? – Which pages brought this amount of attention, and is it something you can replicate?
- How long did they stay? – If they only stayed a few seconds, they probably didn’t find what they were looking for.
- Did they visit any other pages on the site? – This indicates one of two things. One, they found what they wanted and decided to surf the site. Two, they didn’t find what they needed on that page, but thought they might be able to find it elsewhere on your site.
Content Data
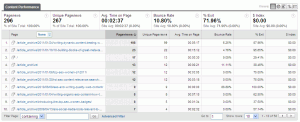
To answer these questions, we’re going to do several things. First, look at pages visited: Content > Top Content. Here, we’re going to stop, because we found something interesting:
The Top Content section automatically shows the top ten. At the heading, you can answer the rest of your questions. The average time on the page for January 24th was 2 minutes and 37 seconds; for a blog, this is pretty decent. Our average exit is 71.96%, meaning the visitor left from the same page they landed on.
Now, our URLs are set up to mark the day, month and year of the blog. We can see right off that our top page was an article posted that day, which got almost 30% of the traffic. People spent an average of 5 minutes on the page (indicating they actually read the article). A high percentage then left; they found what they were looking for and either bookmarked for later or just left the site.
We’re happy with these stats. Of course, like anyone else we’d like to see more traffic, but it’s not half bad. In fact, things are pretty much normal and self-explanatory until we get down to #7. The article received 9 unique page views, but out of those 9 views, we have 0 time on page. Google Analytics says that all nine left from that page as well.
What happened here? The page also has an unusually high bounce rate. Although we don’t focus on this factor, all of them together point out there’s something wrong with this page. Is it the content? The images?
Any time you come across a page with this kind of data, you want to add it to a file of “to visit”. We use an Excel sheet and copy all the data with the link, but you can use whatever tool you feel comfortable using. We’re starring this page as a problem page to revisit.
Keywords Data
Now, there are other sources of data to look through, such as entrance sources. Clicking on the number one page link tells us how people found that page. This is great information, because it helps you pinpoint what referrers bring the most traffic and where you might want to talk about your next piece of content.
The last data we’re going to look at, however, is keywords. Now, for this article, most of our referrers were other sites, not search engines. What we want, however, is to add to our list of potential key terms to target, so that’s what we’re looking at.
By setting the “none” property in the list to “Landing Page”, we can see the keyword they came in on, what page they landed on, and get a good idea of whether we’re fulfilling the needs of those visiting from search.
With the exception of a few terms, it doesn’t seem like our content is meeting the needs of the searcher based on the top ten terms.
For example, the key term “how can I do off page or onpage seo” sent the visitor to “can I just do on page SEO and tell off page to take a hike”. What we’re looking at is different thought processes. They wanted to know how to, and we gave them the answer that it just has to be done. In this case, “how to do off page or on page SEO” is an article we might focus on in the near future.
“Characteristics of authority” and “characteristics of a good quality blog” are also great examples. They were sent to “8 characteristics of high quality link building”, which isn’t relevant to what they were looking for. Here are two more article topics we can focus on.
Others, such as “comscores yellow pages 2010”, we’re going to ignore. It doesn’t have anything to do with our site. If they come from that term, maybe they’ll find something interesting, maybe they won’t, but these visitors aren’t our target market.
Conclusion
Let’s recap. In the walkthrough for this article, we’ve discovered:
- what type of content we currently have that brings in strong traffic (our top ten list for the day)
- a non-performing page that needs repurposing, updating or deletion
- new key terms we haven’t yet targeted
- at least five new topics for our next blogging cycle
As you go through your own discovery and analytics, watch for “trigger points” like the ones we found. Now that you have all the steps, open up your Google Analytics and start digging!
When was the last time you had a Eureka! moment about your site, terms or content? What do you use to make sure you’re providing readers with strong content? Tell us about it!


4 Responses
Its important to supervise what visitors do on our sites and whether they really like what we are offering them. Without visitors, without readers our websites are not going anywhere. In order to have a successful online business its very important to give importance to your visitors.
Without our readers we wouldn’t be here. Just like without Football fans, there wouldn’t be Football, etc. It’s the people that inspire, engage, and ultimately promote your service.
Informative post. Thanks for sharing!
This is a very valuable post. Thanks for sharing your thoughts. Understanding what your visitors actually do on your website is an essential part of usability. By understanding visitor behavior, website owners can have more than just a presence on the web. They can have a successful, growing business as well.