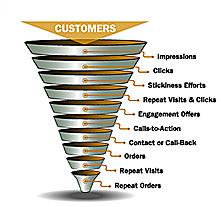
Welcome back to the second installment of our metric measurement info morsels, Acquisition and the KPIs to Track It. Our disclaimer is as follows: the last one was less of a morsel and more of a meal. Sorry ’bout that.
Part one recap: we discussed Awareness, the beginning of the standard business funnel. We talked about market segmentation and gave a few examples of how it could help your marketing campaigns. We also discussed some Key Performance Indicators to track in order to calculate reach and your growing online presence. They are:
- Increased number of social network followers
- Number of unique visitors to your site from referrals
- Number of people who call your business
These KPIs track the success of the Awareness stage, based on the result (i.e. moving into the Acquisition stage). Now that you have this information, let’s go on.
Acquisition – Stage 2 of the Standard Business Funnel
Acquisition is the second stage of the business funnel after a potential consumer finds out about your company. As described in our Search News Central article, Measuring Metrics for Success, it’s the point when your potential visitor becomes an actual visitor. It’s the point where contact is made, whether they follow you on social networks or walk into your physical store for the first time (for this to be reliably measured, your metrics have to cover first time visitors only).
The Reality of Error
It’s seems easy to track. After all, people either follow you or they don’t. They either visit your site, or call, or not. However, if you count every visit, every call and every follow, you’ll skew the numbers from reality.

The reality is one of error. People accidentally follow you and then quickly unfollow when they realize their mistake. Individuals may accidentally click on your search result. They may click and, upon landing on your page, return the SERPs because it wasn’t what they thought it was. Phone numbers can be accidentally dialed. Keep that in mind when looking at the numbers.
Market Segmentation and How It Applies
If you read the preceding article in this series, you’ve seen how market segmentation applies in the Awareness stage. If you have a broad audience, you aren’t going to catch them all by using a single social network, lone T.V. channel or radio station. Direct mail flyers sent to one zip code have little chance of reaching other neighborhoods.
Market segmentation not only allows you to decide how to best reach a niche audience (i.e. parents whose school age kids play sports), it also allows the tracking of that segmentation. In this way, you gain much better insight and a narrower view of each campaign, no matter where that campaign is.
Here’s an example:
You have a bustling business and website that sells sports and athletic equipment. You’re getting ready to run a series of TV ads targeting parents with school age kids. You could run the ad and see an increase in visits to the site around the same time the ad airs, and then assume the entire increase comes from the ads. On the other hand, you could make sure your returns are traceable…
Set up an exclusive action on your site for use during those ads:
- “Visit sports.com; click ‘MyKids’ (picture shown of where this button is) for a 10% discount and free shipping on all of our high school sports products!”
- Include a unique visitor TV page cookie
- Track the visitor using the cookie all the way through to the sale
- “Use code ‘MyKids’ at checkout for a 10% discount and free shipping on all of our high school sports products!”
- Track ad success based on code use
Key Performance Indicators – What Metrics Do I Track?

In choosing your KPIs, ask yourself, “What do I want to achieve from this activity?” Quite simply, now that you’ve caught their attention and they’re on your site, following your networks or calling your phone number, you want them to engage with you. You expect them to:
- Talk with you, retweet, share, like, etc. on your social networks
- Read your blog and talk about it, comment, share it, etc.
- Visit your product pages or otherwise interact with your site
- Interact with customer service on the phone
Based on these actions, your Key Performance Indicators might be:
- The number of new followers that retweet, share, like or contact you on social networks. Track using platforms such as:
- Number of citations since tracking began. Track using platforms such as:
- Average shares, comments, etc. on your blog
- Visits to your product pages based on various referrals (using exit, entrance paths and others to track)
- Question/answer with customer service on the phone, answering the question, “how did you hear about us?”
Measuring and Metric Caveats
Let’s be blunt, m’kay? A computer program is only as good as its programmer and is only as useful as its user knows how to make it. Analytics programs of any type, whether they’re site analytic programs or social monitoring programs, are subject to error. With that said, make sure you read the documentation and help files of any analytics and/or tracking program you’re going to rest the success of your business on.
Moving Forward

You’ll be gaining a lot of information as you begin to set up and implement the various tracking sections and funnels. That’s okay; don’t let it get overwhelming. To keep that from happening, maintain a list of goals and steps per funnel. For example, in Awareness, the goals are to get them to connect with you in some manner. The result is following, visiting, calling.
If the expected result doesn’t happen, there’s something wrong in that part of the funnel. –And this is really what tracking is all about. At some point in time, you aren’t going to meet the expected level of satisfaction as much as you’d like to. You’ll see this when you notice that the result, and thus the next point of the funnel, isn’t being reached.
Use your metrics and the data you’ve gathered to find out why. Start A/B testing, use short surveys, whatever, but find out how you can better satisfy your customer base at each level.
Until next time, here’s to your success!


One Response
We are a great advocate of ‘Online Share of voice’ (OSOV) as a KPI – the collective opinions of positive, negative and neutral social media comments.
Many companies believe that collecting this data is difficult, however all the hard work is handled by tools such as Radian 6, Brandwatch and Lithium that allow you to get at the data you need.
Then it’s just a simple case of adding your new OSOV KPI to your KPI Software tool for real time monitoring.